
Recommendations still beat the feed
New study shows how book buyers in the US discover and choose titles
Published 17 November 2026 · Photo: Magnific
Consumer Compass in figures
Told by friends, chosen by topic
Figures from the 2026 Consumer Compass study of US book buyers by bookinsights.ai
18 %
of purchases were driven mainly by a personal recommendation, against 15 % by social media
47 %
of purchases were made because of the book's subject or topic
58 %
of buyers bought a print book in three months, against 30 % for ebooks
In short
Consumer Compass by bookinsights.ai surveyed 5,119 US book buyers, including 344 teens, about 9,961 books they bought in three months.
A recommendation from someone they know was the most important discovery route for 18 percent of purchases, ahead of social media at 15 percent.
The subject is the most common reason to buy a book (47 percent), ahead of genre (30 percent) and a familiar author (28 percent).
Print reaches the most buyers at 58 percent. Ebook sales are concentrated among heavy buyers, who account for 40 percent of ebook purchases.
A cautious comparison with Codex Group data from 2014 suggests that stores have lost ground as a discovery source and social media has gained. The two studies are not directly comparable.
Who buys which books in the US, how do buyers find them and why do they choose them? The new Consumer Compass study by bookinsights.ai sets out to answer these questions. The first results: a recommendation from someone you know matters more than social media, the subject drives the purchase, and the ebook is the format of heavy buyers. A look back at 2014 hints at where the market has moved. Reliable trends, however, cannot be derived from it.
What Consumer Compass measures
bookinsights.ai, a business intelligence provider for publishers, presented the first results in a launch webinar on November 11 and summarized them in a blog post. The online survey covered 4,775 adults and 344 teens aged 13 to 17. All of them had paid for a book in the previous three months, either by buying it outright or through a subscription.
In total, respondents described 9,961 purchases. Each purchase was matched to a specific title and placed in one of 54 categories. The study aims to close a gap: sales data show which books sell, reader surveys show who reads. Consumer Compass connects the two by showing who buys which books, how they come across them and why.
Recommendation beats social media
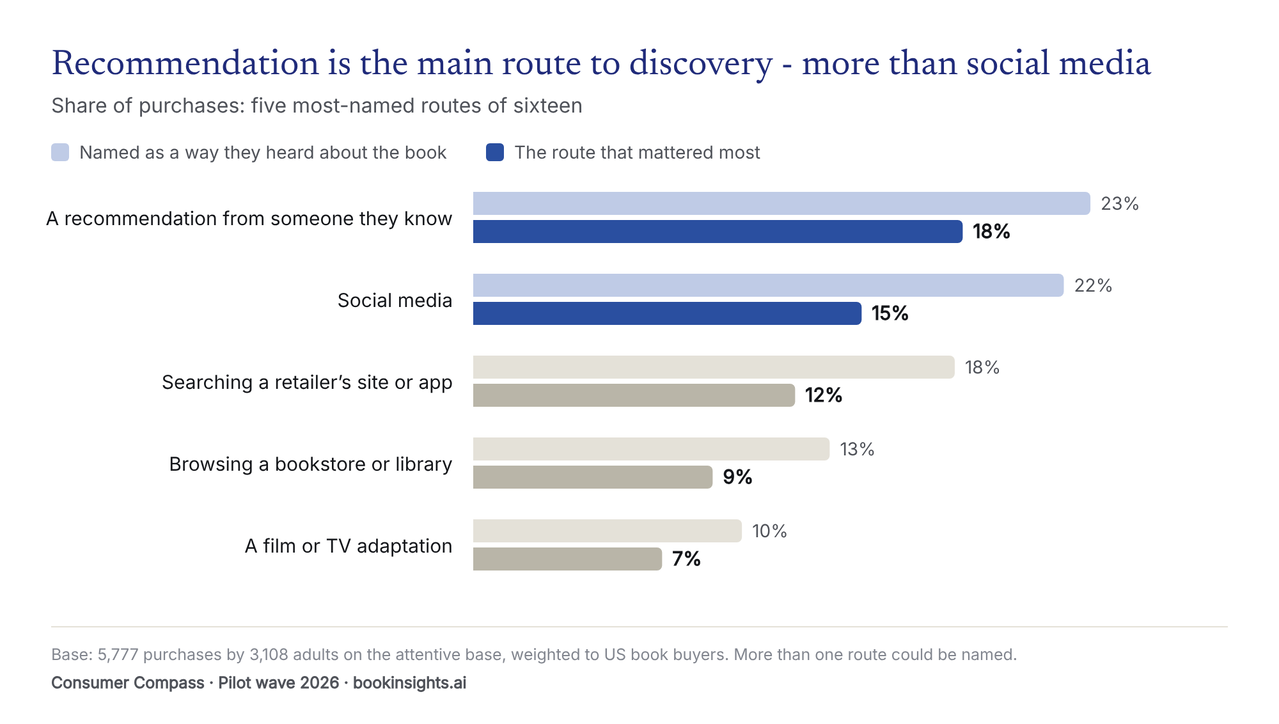
For each purchase, respondents said how they had heard about the book and which route mattered most. As a point of contact, a recommendation from someone they know (23 percent of purchases) and social media (22 percent) are named almost equally often. Asked which route mattered most, recommendation leads clearly with 18 percent, ahead of social media with 15 percent.
bookinsights.ai reads this as follows: social media spreads the word about a book, but a personal recommendation is more often what starts the path to purchase. Next come searching a retailer's site or app (twelve percent as the most important route), browsing a bookstore or library (nine percent) and film or TV adaptations (seven percent).
The subject decides
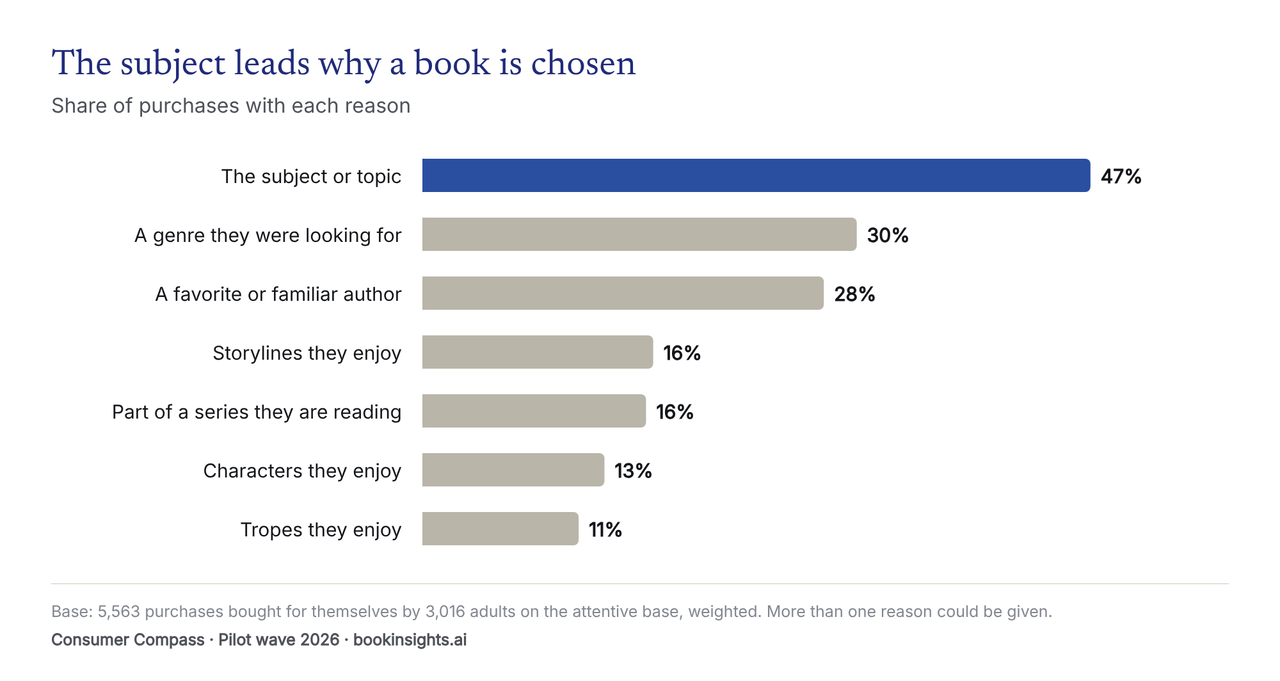
How someone hears about a book is one question. Why they then buy it is another. Here the subject or topic leads clearly: it was a reason for 47 percent of purchases. It is followed by a genre the buyer was looking for (30 percent) and a favorite or familiar author (28 percent).
Story elements matter too. Storylines and being part of a series each account for 16 percent, characters for 13 percent and tropes for eleven percent. How strongly these patterns differ between categories is shown only in the paid category reports.
Print has the reach, the ebook has the heavy buyers
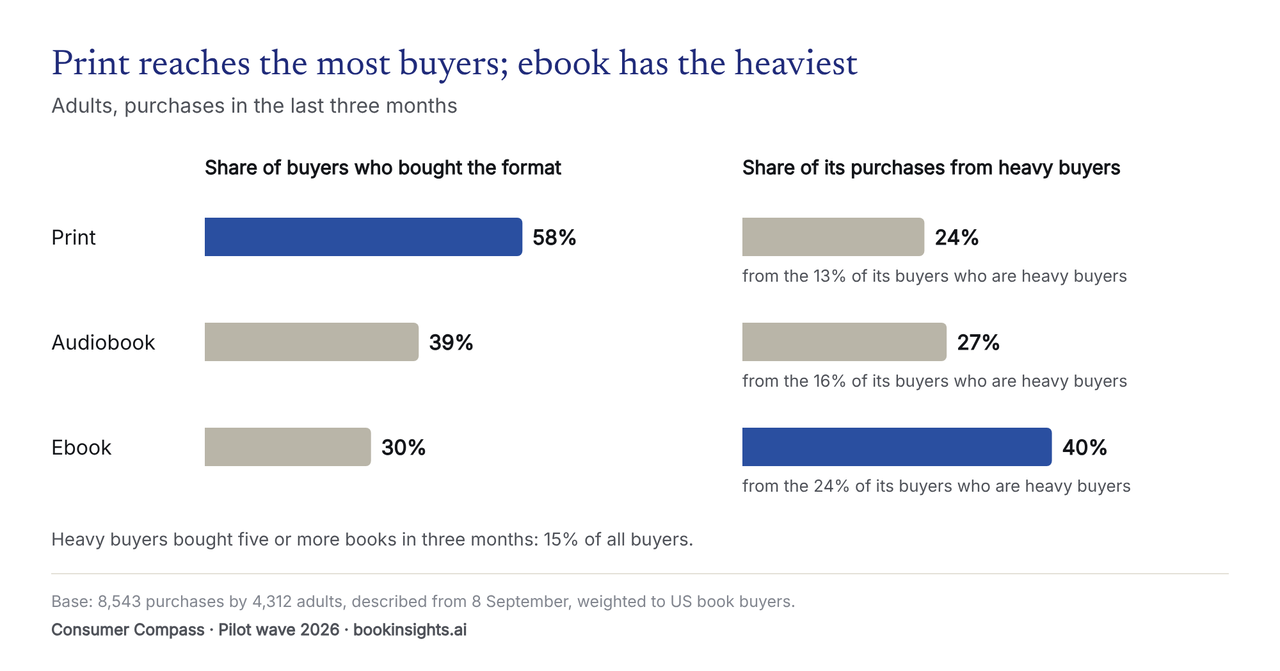
58 percent of book buyers bought a print book in the three months. 39 percent bought an audiobook, 30 percent an ebook. Print thus reaches the most people.
Purchase volume tells a different story. Heavy buyers are defined as people who bought five or more books in three months; they make up 15 percent of all buyers. For ebooks, 40 percent of purchases come from the 24 percent of ebook buyers in this group. For audiobooks the figure is 27 percent of purchases, for print only 24 percent.
The questions on discovery and reasons for purchase are based on 3,336 adults who, according to bookinsights.ai, answered at a considered pace. Format figures are based on purchases described from September 8. More detailed findings are available in the paid national report, in category reports and through a dedicated data interface. The next wave has been announced for 2027.
A cautious look back at 2014
Comparative data come from a study by Peter Hildick-Smith's Codex Group, which has been made available to DIGITAL PUBLISHING REPORT. For its "U.S. Adult Book Buyer Preview" in the first quarter of 2014, Codex surveyed 5,117 adult book buyers in the US at the end of March 2014, all of whom had bought a book in the previous month.
At first glance the two studies fit together well: same market, almost identical sample size, questions about a specific purchase. Methodologically, however, they differ in important ways. The figures are therefore not directly comparable and serve at most as indications.
Different question: Codex asked how buyers first found out about the book they bought last. Consumer Compass asks which route mattered most. First contact and decisive trigger are not the same thing.
Different answer logic: In 2014 exactly one answer was allowed. In 2026 respondents could name several routes and then pick the most important one.
Different categories: The discovery routes are grouped differently. Codex, for example, did not report social media separately.
Different time frame: In 2014 a purchase in the previous month counted, in 2026 one in the previous three months, subscriptions included.
Different institutes: Sampling and weighting were set up differently and are not fully documented in public.
Recommendations look remarkably stable
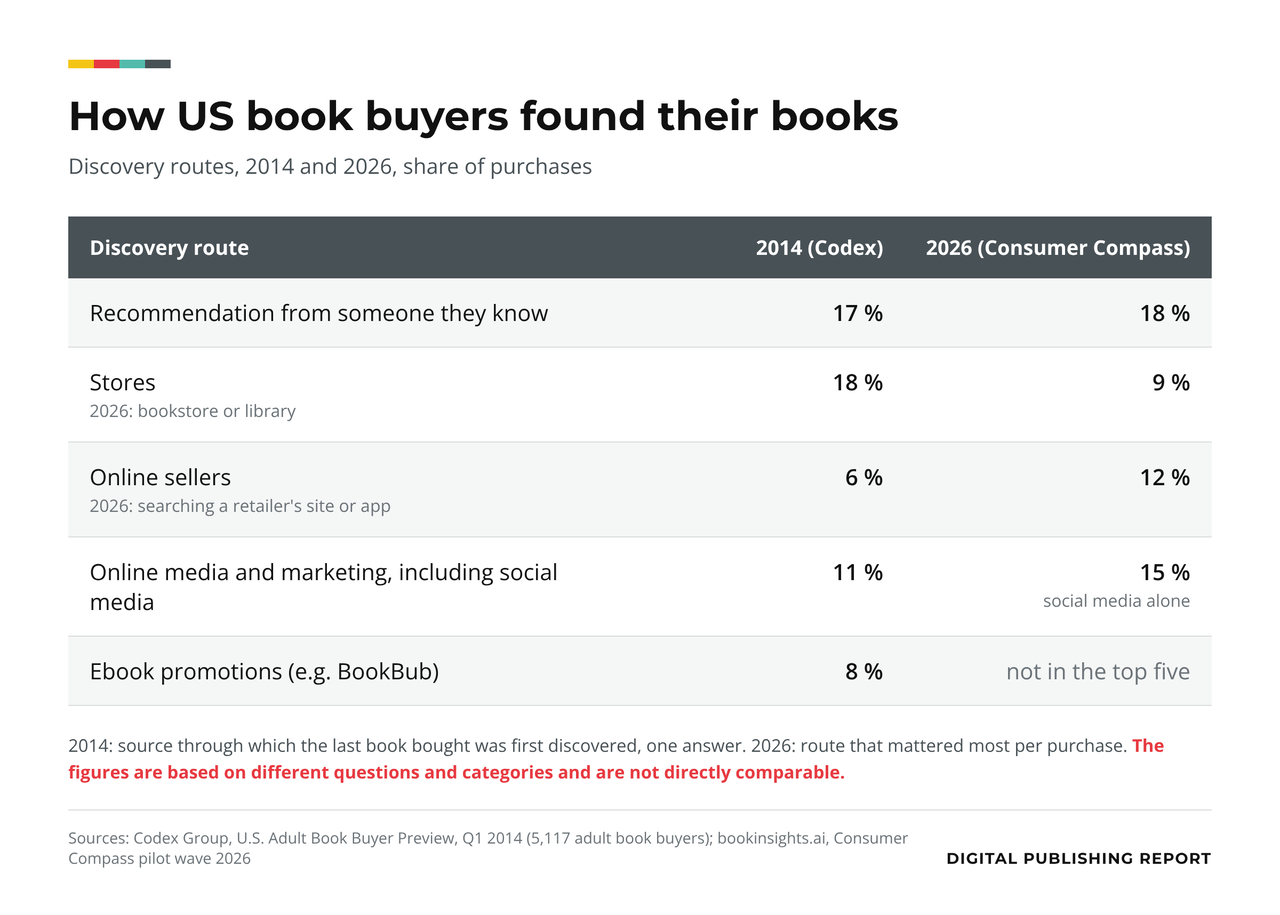
In 2014 a recommendation from someone they know was the starting point for 17 percent of purchases; in 2026 it is the most important route for 18 percent. Because the two questions measure different things, this does not prove stability. But nothing suggests that personal recommendations have lost importance.
Signs of a shift away from stores
In 2014 stores were the most important single source at 18 percent. Among customers of Barnes & Noble, Target and Walmart the share was 27 to 29 percent, among Amazon customers 13 percent. In 2026 nine percent name browsing a bookstore or library as the most important route.
The gap is large, but the categories do not match. The Codex category also included chains such as Walmart and Target, while the 2026 category is narrower. The same applies to online retail: in 2014 Codex measured six percent for online sellers, in 2026 Consumer Compass measures twelve percent for searching retailers' sites. The direction is consistent with how the market has developed; the size of the shift cannot be read from the two studies.
Social media appears as a channel of its own
In 2014 Codex did not report social media separately. The category "online media and marketing" reached eleven percent overall, all digital routes together 24 percent. Ebook promotions such as BookBub, at eight percent, were seen as the new driver at the time. In 2026 social media alone reaches 15 percent. That social networks have become more important for book discovery is plausible. By how much cannot be quantified with these data.
Print remains the base
In 2014, 96 percent of book buyers read print books, only four percent read exclusively digital. At the same time, 69 percent already read at least partly in digital form. Audiobooks played hardly any role in the study.
In 2026 Consumer Compass measures purchases rather than reading preference: print reaches 58 percent, audiobooks 39 percent, ebooks 30 percent. The figures therefore cannot be set against each other. They do suggest, however, that print has kept the broadest base and that the audiobook has joined as a relevant format.
What the comparison cannot show: Codex did not ask in 2014 why a book was bought, at least not in this form. Whether the subject was as dominant then as it is today therefore cannot be said for the US. Reliable time series can only come from Consumer Compass itself, once a second wave with the same methodology follows in 2027.
Newsletter
The latest from DIGITAL PUBLISHING REPORT every week
New articles from all sections, delivered by email once a week.